Heterogeneity
Lowers Herd Immunity, but Overshoot is still there
In a recent article, Apoorva Mandavalli [1] asks if we are
closer to herd immunity than previously believed. She discussed three papers that discuss lower
herd immunity thresholds (HIT) due to heterogeneity in the population. All
three papers use SEIR models, but with varying approaches. The papers by
Lourenco et al [2] and by Gomes et al [3] are less easy to use, but the paper
by Britton et al [4] is more understandable. Mandavalli [1] also discussed
these papers with other scientists to get an idea of whether a new scientific
consensus is emerging.
The reason why this question is pressing is that we all want
to know: when will it be over? Conventional HIT values are given in the 60-70%
range. These authors argue that it could be lower. Indeed Britton’s value of
43% (higher than the other two) may have informed the Swedish ‘hands off’
attitude of ‘voluntary compliance’ in the last few months, along with the
attitude that everybody is going to get infected sooner or later, no matter
what we do. In this post, as before, I want to calculate the cutoff percentage
Xco at which the epidemic actually stops [5], which is higher
than the HIT, which is merely the point at which the number of infectious cases
peaks, and herd immunity effects start to kick in. These papers have been
widely discussed by several authors [6- 14], and various points that they have
raised will be discussed later.
Lourenco et al [2] state that the standard formula for the
herd immunity threshold (HIT):
HIT = 1 – (1/R0)
is modified if a fraction r
of the population is resistant to infection, becoming:
HIT = (1 - r){
1 – (1/R0)f} where:
f = 1/[1 – (c1/c2){r/(1 - r)}(1 - d)]
where c1 and c2 are the contact rates
for the two sub-population groups, and the interaction matrix (of the two
sub-populations) d. The
parameter d lies
between 0 and 1.
This equation for HIT suggests that a wide variation in HIT
will occur depending upon: (i) the proportion that is resistant to infection
(ii) the R0 within the non-resistant group, and (iii) the degree of mixing
between the two groups.
a)
When d
= 1, there is no mixing between the two sub-populations, it is
assortative within the groups;
b)
Random (or proportionate) mixing occurs
when d = r; HIT reduces to the expression:
HIT = 1 – (1/R0) – r.
c)
when d
= 0, there is maximal mixing between the two subgroups.
What is not clear is: what is the difference
between (b) and (c), between random and maximal mixing?
The proportion r
of the sub-population 1 being resistant to infection means R0,1 = 0.
The group specific R0,I = bi ci/sI is the R0
of the ith group, or the fundamental transmission potential of the
virus within a homogeneous population consisting of members of that group. The
rates of loss of infection and immunity are given by respectively by s and g.
a)
In the no-mixing (fully assortative) case (when d
= 1), f =1, and the herd immunity threshold reduces to: HIT = (1 - r) (1 – 1/R0). That
is, for this case, HIT declines in
proportion to the size of the resistant group.
However, this is not very clear: if there is no mixing between groups 1
and 2, why should HIT for group 2 be independent of r, and given by the standard
expression for HIT? Especially since the standard HIT does not involve the size
of the population?
b)
But for random mixing (c1 = c2 Þ d = r): z* = 1 – (1/R0) - r. That is, the virus will
not spread if r ³ 1 – (1/R0).
This is the standard case, because there is no difference between sub-groups 1
and 2 (z is the sum of the numbers of infected and recovered persons).
If c1 ¹
c2, random mixing occurs when d
= r c1/[r c1 + (1 - r c2)]
c)
Maximal mixing case (d = 0): the authors do not
pursue this case. Also, it is not clear: what is the difference between random
mixing and maximum mixing?
The authors conclude:
“The drop in HIT is proportional to the
fraction of the population resistant only when that fraction is effectively
segregated from the general population; however, when mixing is random, the
drop in HIT is more precipitous.”
In addition, they also add that their results are similar to
those of Gomes et al [3] but that their values are lower than those obtained by
Britton [4].
I have a couple of doubts about
the paper by Lourenco…Gupta [2] which I have mentioned above. However, since I
have not derived the equation used by that group, it may not be fair to
comment.
Gomes [3] argues that
“individual variation in susceptibility or exposure (connectivity)
accelerates the acquisition of immunity in populations due
to selection by the force of infection.”
The paper of Gomes et al [3], using a SEIR model, assumes variable
susceptibility and exposure, and both susceptibility and exposure
(connectivity) are given by gamma distributions. The gamma distribution is fitted
to experimental data for 11 countries, but one fitting parameter is the
coefficient of variation, CV, defined as the ratio of the standard deviation to
the mean. (The infectiousness of exposed individuals is assumed as half of that
of exposed individuals; the incubation period is 4 days and the period of
infectiousness is assumed as 4 days). Gomes
et al use values of CV ranging from 0 to 3, and plots the herd immunity
threshold HIT vs variable CV. For CV = 3, they get values as low as 10%. We
will return to Gomes later. The results of Gomes will be discussed later.
Let’s now look at Britton et al [4].
Traditionally:
Table 1:
|
R0
|
h0 = 1 - (1/R0)
|
xco
|
|
2
|
0.5
|
0.8
|
|
2.5
|
0.6
|
0.89
|
|
3
|
0.667
|
0.94
|
H0 is the herd immunity threshold, xco
is the population cutoff fraction at which infection stops (Bastin [5])
R0 = - [ln(1-x)]/x
Britton takes into account age structure &
variable social activity to obtain a value haa. Specifically,
the population is divided into 6 different age groups (0-5, 6-12, 13-19,20-39,
40-59 and 60+ years) and three different activity levels (normal, doubled and
half).
Table 2:
|
R0
|
haa = 1 - (1/Re)
|
Re
|
|
2
|
0.346
|
1.53
|
|
2.5
|
0.43
|
1.75
|
|
3
|
0.491
|
1.96
|
The equation haa = 1 - (1/Re) is an assumption
to create an effective R-number Re for the situation of age
structure & variable social activity. It may not be valid (but it turns out
OK!).
Fitting the data of Re vs R0 yields a linear
plot:
Re = 0.672 + 0.43R0
We can use this to extrapolate to values of R0
other than those calculated by Britton.
Re = ln(s¥)/[
1 – s¥]
Varying R0 one can generate a plot of s¥ vs R0
accounting for age structure & variable transmissibility:
Table 3:
|
R0
|
haa = 1 - (1/Re)
|
Re
|
Xco
|
|
1.5
|
0.241
|
1.32
|
0.43
|
|
2
|
0.346
|
1.53
|
0.60
|
|
2.5
|
0.43
|
1.75
|
0.71
|
|
3
|
0.491
|
1.96
|
0.78
|
|
3.5
|
0.541
|
2.18
|
0.84
|
|
4
|
0.582
|
2.39
|
0.88
|
We are also assuming that the equation above for calculating
the population cutoff Xco remains valid when we plug into it the
effective R-value, Re.
The extrapolation of Re vs R0 to
values other than those calculated by Britton (R0 = 2, 2.5 &3)
is relatively more reasonable, since the plot seems to be linear. But it is an
assumption, to be sure.
Xco takes into account overshoot along with age
and variable activity. This is the fraction at which the epidemic stops.
Fig.1: age
& activity [4]
The lower curve is the herd immunity threshold as calculated
by Britton, for the case of age structure and activity structure. The upper
curve is the population fraction at which the epidemic dies out completely and
no more infections occur.
Britton has two more columns, in which he accounts for only
age structure and only for variable activity. Using similar logic for the
social activity – which Britton says is more important:
Re = 0.603 + 0.50R0
Table 4:
|
R0
|
haa = 1 - (1/Re)
|
Re
|
Xco
|
|
1.5
|
0.261
|
1.35
|
0.46
|
|
2
|
0.376
|
1.60
|
0.64
|
|
2.5
|
0.460
|
1.85
|
0.75
|
|
3
|
0.524
|
2.10
|
0.82
|
|
3.5
|
0.575
|
2.35
|
0.87
|
|
4
|
0.616
|
2.60
|
0.90
|
This plot looks almost the same as the previous one – but it
is displaced slightly upwards.
For the case of age-structure only:
Re = 0.21 + 0.82R0
Table 5:
|
R0
|
haa = 1 - (1/Re)
|
Re
|
Xco
|
|
1.5
|
0.305
|
1.44
|
0.54
|
|
2
|
0.459
|
1.85
|
0.75
|
|
2.5
|
0.558
|
2.26
|
0.85
|
|
3
|
0.625
|
2.67
|
1.00
|
|
3.5
|
0.675
|
3.08
|
1.00
|
|
4
|
0.713
|
3.49
|
1.00
|
Fig.3: age
structure only [4]
This plot, for age structure only, is clearly pushed upwards
– especially for R0 of 3 and above – where it hits 100% of the
population.
Of course, as R0 increases, the percentage
asymptotically increases towards 100% and does not actually reach a hundred –
the above results are due to numerical inaccuracies.
Britton says that the activity structure is dominant and the
age structure does not play so much of a role (roughly activity is 3X as
important as age in his calculations).
The data given by Lourenco et al [2] can be handled
similarly. However, the values of HIT – as pointed out earlier – are much
lower:
This table (1st 2 columns from Table 1 in Ref.2)
is for assortative mixing (i.e. no mixing of groups 1 & 2):
Table 6:
|
R0
|
heff = 1 - (1/Re)
|
Re
|
Xco
|
|
1.5
|
0.16
|
1.19
|
0.30
|
|
2
|
0.25
|
1.33
|
0.45
|
|
2.5
|
0.30
|
1.43
|
0.53
|
|
3
|
0.33
|
1.49
|
0.57
|
Similarly, for proportionate mixing:
Table 7:
|
R0
|
heff = 1 - (1/Re)
|
Re
|
Xco
|
|
1.5
|
0
|
1
|
0
|
|
2
|
0
|
1
|
0
|
|
2.5
|
0.10
|
1.11
|
0.19
|
|
3
|
0.16
|
1.19
|
0.30
|
Fig.4:
assortative and proportionate mixing [2]
The values for heff and Xco are shown
in Fig.4 for both assortative and proportionate mixing.
Gomes et al [2] considered variable susceptibility and
variable connectivity (separately) – but also mentioned the ‘final size of the
uncontrolled epidemic’ in their Fig.3. This is listed in the 3rd
column 9in the two Tables below) and compares pretty well with the value of Xco
(in the 5th column in the two Tables below) as calculated from Re
(obtained as above from h).
Gomes et al [2] has only considered R0 = 3 but
with variable susceptibility CV (as mentioned above):
Table 8:
|
CV
|
heff = 1 - (1/Re)
(from Gomes)
|
Final % of epidemic (from Gomes)
|
Re
|
Xco
|
|
0
|
0.65
|
0.94
|
2.86
|
0.93
|
|
1
|
0.43
|
0.67
|
1.75
|
0.71
|
|
2
|
0.2
|
0.33
|
1.25
|
0.37
|
|
3
|
0.1
|
0.17
|
1.11
|
0.19
|
|
4
|
0.07
|
0.11
|
1.08
|
0.14
|
This is shown graphically:

Fig.5:
variable susceptibility [3]
Gomes et al [3] has only considered R0 = 3 but
with variable connectivity CV (as mentioned above):
Table 9:
|
CV
|
heff = 1 - (1/Re)
(from Gomes)
|
Final % of epidemic (from Gomes)
|
Re
|
Xco
|
|
0
|
0.65
|
0.94
|
2.86
|
0.93
|
|
1
|
0.31
|
0.54
|
1.45
|
0.55
|
|
2
|
0.12
|
0.23
|
1.14
|
0.23
|
|
3
|
0.07
|
0.125
|
1.07
|
0.12
|
|
4
|
0.04
|
0.08
|
1.04
|
0.07
|
In this case, the values of Xf and Xco
agree somewhat better:

Fig.6:
variable connectivity [3]
Neither Lourenco [2] nor Britton [4] mentions overshoot, but
Gomes [3] clearly does by tabulating Xf (the final composition of
the population after the epidemic is over)
Making some assumptions, we have calculated the value Xco
at which transmission of the virus completely stops. These assumptions may not
be correct – but the conclusions are plausible. And they do match pretty well
with the calculations of Gomes [3] – although the matching is better for the
variable connectivity case (Fig.5) than it is for the variable susceptibility
case (Fig.4).
Discussions:
At this point, it is worth examining what various authors
[6-14] have concluded, based on the three papers and their understanding. Since
there is considerable overlap, only some points will be taken up.
Jha [6] discusses Sweden’s approach of voluntary compliance
and the statistics that show that Sweden did better than the UK – but
significantly worse than its Nordic neighbours, and attributes the high death
rates to a flawed approach to taking care of the elderly in care homes and foreign
migrant labour in crowded urban areas. He points out that 85% of Sweden’s
population lives in cities and that the elderly in Sweden’s care homes were
already frail (28% of men and 19% of women would die within 6 months of
entering the facility, in normal times) and where half of all deaths
occurred. Anders Tegnell expected 25% of the population to contract the virus
based on Britton’s model [4], while in crowded Stockholm it was a little more
than 20%. However, Johann Giesecke still argues that, despite setbacks, the
Swedish strategy as a whole is not disqualified. Indeed, he said,” I expect
when we count the number of deaths in each country in one year from now, the
figures will be similar, regardless of the measures taken.” Giesecke has
heavily criticized Ferguson’s paper as fundamentally flawed by debatable assumptions,
which nevertheless, provoked ‘a huge over-reaction’ all over the world, but
especially in the U.K. and the U.S. Needless to say, Giesecke does not mention
the cutoff Xco and sticks to the HIT.
Vineeta Bal [7] discusses the results of serological surveys
in India: particularly Delhi (23% sero-positivity), Mumbai (40%), Berhampur
(31%). She also points out that it was 51.5% in Pune, ranging from 65% in the
most crowded districts to 31% in the least crowded districts. Similar results
were obtained in Mumbai (16-57%), with the highest sero-positivity (57%) in the
slums of Dharavi. However, Vineeta Bal emphasizes that these tests do not mean
that the residents of Dharavi are immune, because the serological test used
only detects antibodies, not ‘neutralizing antibodies’, which confer immunity
(and are more difficult to detect. It will take 6 weeks to get results,
according to Arunab Ghose of IISER). So, while the number of cases in Dharavi
has come down, it is premature to conclude that it is because of herd immunity.
The town of Bergamo, the epicenter of the covid-19 outbreak
in Italy, recorded 57% of the population had developed antibodies [8].

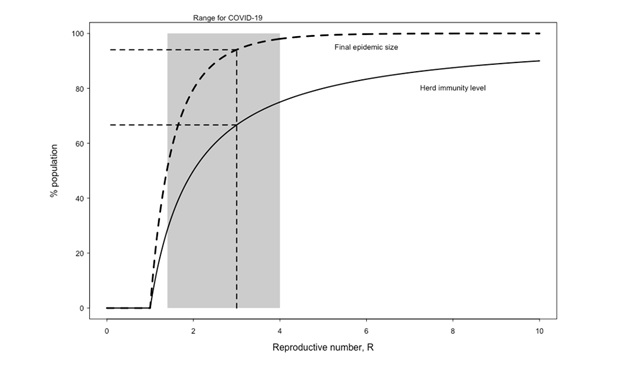
Fig.7: HIT
& Xco vs R0 from [9]
The above figure is from Kleczkowski [9], and it plots both
HIT and Xco as a function of R0. Kleczowski is rather
balanced, merely pointing out that the concept of herd immunity is ‘not without
controversy’ and would lead to a large number of excess deaths. Kleczkowski
accepts that diversity (heterogeneity) in the population will lower the HIT
from the 60-70% value for a homogeneous population to a value as low as 10%, and mentions the above
3 papers.
Hartnett [10] also points out that in some cases the
threshold could even be higher, e.g. in a nursing or care home. But, ‘on a
larger scale’ any heterogeneity in the population (a variable R0) will lower
the threshold, since the virus will first pick off the more susceptible but the
epidemic slows down when it starts coming up against less susceptible hosts. Tom Britton feels now
that 43% is too high, and that additional sources of heterogeneity, not
considered in their published model, may lower the threshold even more.
Gabriela Gomes believes that Madrid may be approaching the 20% threshold that
their group has calculated. Many other experts, according to Hartnett, believe
that these studies are not completely reliable and are cautious about endorsing
them, because behavior of people is often random and difficult to model. Kate
Langwig (a co-author of Gabriela Gomes) feels that estimating heterogeneity is
indeed difficult but it is important to do it: “We have been sloppy in thinking
about herd immunity”. Jeffrey Shaman of Columbia objects that 20% is not
consistent with other respiratory viruses: if it isn’t 20% for flu, why should
it be for covid-19?
Hamblin [11] has discussed Gomes’s paper and introduces
chaos into it, arguing that Gomes works on chaos, even though she does not use
the word anywhere in her paper. Nevertheless, Hamblin says that dynamic systems
can be unpredictable and small changes in susceptibility can lead to large
consequences for the outcome of the epidemic - which may be a factor in the low predictability of pandemics. Britton does not think 20% is
likely, and favours a higher number. Marc Lipsitch (of Harvard and author of
‘Rules of Contagion’) initially quoted 40-70% but, in later discussions with
Hamblin, lowered his estimate to 20-60%, but with an increasing degree of
skepticism as the threshold approaches 20%. Shweta Bansal also argues that
under certain conditions (nursing homes) the threshold could exceed 70%.
Harry Stevens [12] quotes Yale epidemiologist Marcus Russi
to say (about the U.S.) that: “There’s just way too little seroprevalence in
all of these states to come anywhere close to achieving herd immunity.” But the
higher range of sero-prevalence estimates in the U.S. is 25% - which is much
lower than traditional values – but in the same ball-park as the estimates of Gupta
[2] and Gomes [3] – but lower than that of Britton [4]. Stevens [12] does not
mention the three papers being discussed here.
Fig.8: Herd
immunity threshold and Overshoot [13]
Bergstrom and Dean [13] wrote in the NYT about
‘overshoot’ beyond the HIT, and emphasize that when we reach the HIT: “That’s not when things stop — it’s only when they start to
slow down.” They also do not discuss the three papers, sticking to the
original values of ‘nearly two-thirds’ of the population. According to
Bergstrom and Dean: “A runaway train
doesn’t stop the instant the track begins to
slope uphill, and a rapidly spreading virus doesn’t stop right when herd
immunity is attained.”
Regalado [14] quotes a tweet by
Florian Klemmer: “It seems there is the ‘herd immunity is already reached’ team
and the ‘we are all going to die’ team. The good thing is, there is a third, ‘let’s
get the data and let’s look at what this all means’ team out there.” Regalado
also quotes Marc Lipsitch to say that the disease itself, when it causes herd
immunity, does so more ‘efficiently’ than giving out the vaccine at random.
According to Youyang Gu, roughly 10% of the U.S. population has now been
infected. But, estimates vary widely: 10-80% of the population might have to be
infected, depending on how well the virus spreads, but also on social factors
like how much people ordinarily mix with one another (to achieve herd immunity).
Apoorva Mandavalli [1] points out
that in some clinics in the U.S. as many as 80% of people who were tested had
antibodies to the virus, with teenage boys having the highest prevalence. In
Queens the prevalence was as high as 68%, while it was as low as 13% in
Brooklyn. Most experts that Mandavalli discussed the papers with were not
willing to accept herd immunity thresholds as low as 10-20%. Biostatistician
Natalie Dean asked: where is the evidence that the detected antibodies are
actually immuno-protective? Carl Bergstrom argued that, while such low herd
immunity thresholds, were mathematically possible, these models are, at the
moment, ‘guesses’. Other experts pointed out that all models are flawed because
they over-simplify reality and do not accurately represent real world
conditions. Jeffrey Shaman considered Gomes’s model as a ‘possible solution’
but questioned the wide range of parameters for different countries in the
study. Most researchers are wary of concluding that the hardest-hit
neighborhoods of Brooklyn, or even the blighted areas of Mumbai, have reached
herd immunity or will be spared future outbreaks.
Franks and Roclov [15] point out
that the percentage of antibodies observed in the Diamond Princess was about
20%, and similar numbers have been obtained in Stockholm, New York and London –
suggesting that there is something in the 20% idea. However, the prevalence was
as high as 54% in the Hartsville Correction Center. The authors discuss the
idea of ‘immunological dark matter’, first mentioned by Friston [16] (50% of
any population is not susceptible to infection because of cross-immunity from
other infections and geographic isolation), but point out that the fact that
values much higher than 20% mean that the T-cell innate immunity hypothesis
remains to be proved. Finally, if a 20% threshold does exist, it applies to
only some communities, depending on interactions between many genetic, immunological,
behavioral and environmental factors, as well as the prevalence of pre-existing
diseases.
Resnick [17] discusses the
possibility that immunity may have a limited shelf life, maybe as little as 3
months. Under such conditions, the ‘let it rip’ approach to going for herd
immunity in a society by uncontrolled (or lightly controlled) infection, may
not make much sense. Resnick also discusses the various tests for viruses, antibodies,
T-cells, B-cells etc. Resnick [18] also quotes Harvard epidemiologist Stephen
Kissler [19] who advocates ‘stop-and-go’ social distancing and predicts that it
might take till 2022 to build up enough immunity in the population, if it is
done in a cautious manner.
Overall, the consensus seems to
be that heterogeneity does lower the herd immunity threshold, but whether it
goes as far down as 10% is not clear. Britton’s paper is the only one to be
peer-reviewed, and in the paper the authors state that the calculated values
are ‘indicative’, not set in stone. The point I want to emphasize in this post
is that even if heterogeneity reduces the herd immunity threshold to values as
low as 10-20% - which most experts believe to be unlikely – the fact of
overshoot cannot be ignored. Sunetra Gupta [2] is well aware of overshoot, but
only Gabriela Gomes [3] actually gives the values in her paper (as given above
in Tables 8 & 9). The cutoff values Xco are significantly
higher. It is these values that should concern us – when the epidemic is
over, not when it peaks. The values quoted above for serological studies in
London, New York, Stockholm, Mumbai etc refer to points in time where the
epidemic is definitely past its peak, if not exactly ended, so the appropriate
number is the cutoff Xco, not the herd immunity threshold.
References:
1.
Apoorva Mandavalli https://www.nytimes.com/2020/08/17/health/coronavirus-herd-immunity.html
2. 2. Jose Lourenco… Sunetra Gupta medRxiv 16th July 2020 https://doi.org/10.1101/2020.07.15.20154294
3.
M.G.M.Gomes et al medRxiv 2nd May 2020
https://doi.org/10.1101/2020.04.27.20081893
4.
Tom Britton et al Science 14th July
2020 Science 10.1126/science.abc6810
(2020).
5. 5. G.Bastin: “Lectures on mathematical modeling of
biological systems,” 22nd Aug.2018 (GBIO 2060)
6. 6. Ramanath Jha, “Sweden’s ‘Soft’ COVID-19
Strategy: An Appraisal,” ORF Occasional Paper No. 258, July 2020, Observer
Research Foundation
7.
Vineeta Bal and Satyajeet Rath https://indianexpress.com/article/explained/sero-surveys-during-covid-19-why-do-they-matter-what-do-they-say-6558977/
8.
Niclas Rolander https://theprint.in/world/sweden-proves-surprisingly-slow-in-achieving-herd-immunity/443329/
9.
Adam Kleczkowski https://scroll.in/article/968357/why-herd-immunity-may-not-be-the-perfect-solution-to-coronavirus
10 Kevin Hartnett https://www.quantamagazine.org/the-tricky-math-of-covid-19-herd-immunity-20200630/
11.
James Hamblin The Atlantic 13th July
2020 https://www.theatlantic.com/newsletters/archive/2020/07/coronavirus-herd-immunity/614116/
12.
Harry Stevens https://www.washingtonpost.com/graphics/2020/health/coronavirus-herd-immunity-simulation-vaccine
13.
Carl T.Bergstrom and Natalie Dean https://www.nytimes.com/2020/05/01/opinion/sunday/coronavirus-herd-immunity.html
14.
Antonio Regalado MIT https://www.technologyreview.com/2020/08/11/1006366/immunity-slowing-down-coronavirus-parts-us/
. 15. Paul Franks
and Joacim Rocklov https://theconversation.com/coronavirus-could-it-be-burning-out-after-20-of-a-population-is-infected-141584
16.
Karl J.Friston
et al, “Tracking and tracing in the U.K., a dynamic causal modeling study,” Technical
Report 2005.07994
17.
Brian Resnick 28th April 2020 https://www.vox.com/science-and-health/2020/4/28/21237922/antibody-test-covid-19-immunity
18.
Brian Resnick 15th May 2020 https://www.vox.com/science-and-health/2020/5/15/21256282/immunity-duration-covid-19-how-long
19.
Stephen M.Kissler et al, “Projecting the
transmission dynamics of Sars-Cov-2 through the post-pandemic period” Science
368 (2020) 860-868 (22nd May
2020)